
Strategi unik untuk berdagang pada pasaran julat terikat
Artikel ini menerangkan bagaimana paras sokongan dan rintangan, bersama bacaan ekstrem stokastik, lazimnya digunakan untuk mengenal pasti tingkah laku harga dalam pasaran julat-terikat.
tempoh masa: semua
Pasangan mata wang: pasangan silang
Keadaan pasaran: julat-terikat
Keadaan julat-terikat, atau pergerakan mendatar, boleh berlaku pada mana-mana pasangan mata wang, namun ia lebih lazim dalam pasangan silang seperti AUDNZD, GBPCAD dan EURGBP—iaitu apabila harga tidak mempunyai trend yang jelas dan sebaliknya bergerak antara dua paras ekstrem.
Dalam pasaran julat-terikat, trader biasanya mengenal pasti paras sokongan (tempat harga cenderung berhenti jatuh) dan paras rintangan (tempat harga cenderung berhenti naik), kemudian mengukur jarak antara kedua-duanya.
Indikator yang diperlukan:
- Tiada penunjuk khusus yang diperlukan. Walau bagaimanapun, Jalur Bollinger lazimnya digunakan untuk membantu mengenal pasti pasaran julat-terikat, manakala Stokastik (21, 1, 3) kadangkala digunakan sebagai penunjuk tambahan bersama paras sokongan dan rintangan.
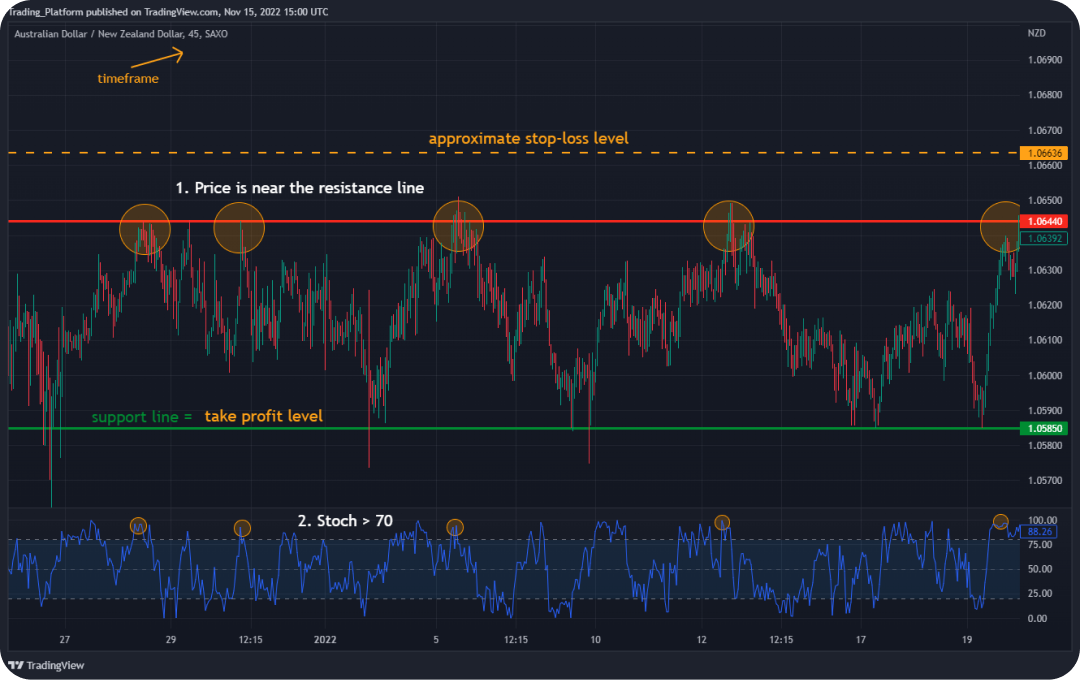
Potensi kemasukan posisi jual
1. Harga didagangkan berhampiran garisan rintangan.
2. Bacaan stokastik berada di atas 70.
article_rngbnd_body9
Gabungan ini mungkin menandakan bahawa harga sedang menghampiri sempadan atas julat.
article_rngbnd_body11
article_rngbnd_body12
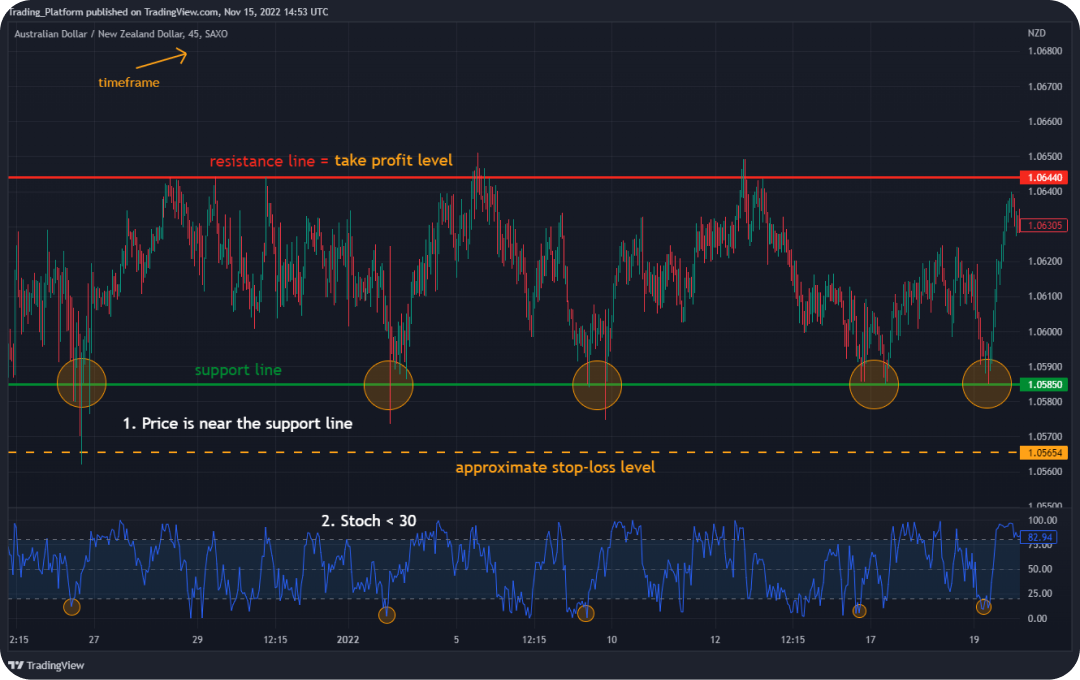
Potensi kemasukan posisi beli
1. Harga didagangkan berhampiran garisan sokongan.
2. Bacaan stokastik berada di bawah 30.
article_rngbnd_body14
Gabungan ini mungkin menandakan bahawa harga sedang menghampiri sempadan bawah julat.
article_rngbnd_body16
article_rngbnd_body17
article_rngbnd_body18
Muat turun tetapan penunjuk ke platform desktop anda
Jika anda sedang mencari kaedah pantas untuk menggunakan penunjuk daripada strategi ini, klik butang di bawah.